Dec 14, 2021 | written by: Elisa Lanza
The earth is warming up. But what scientific data has led to this claim? It isn’t easy to verify the reliability of such a complex measurement. Advances in technology, the repositioning of survey stations and the differing amounts of data collected over the centuries are just some of the factors involved in creating a reliable and congruent temperature record.
Paleoclimatology: the first data
The first series of temperature measurements dates back to the early 1600s. However, 1880 is the first year on record when sufficient data was collected to allow us to form a coherent series. All the measurements we have for dates prior to this come from “proxy data” such as tree rings, pollen and plant fossil analysis, and ice and rock sampling. These are all indirect methods; although they do provide fundamental indications on temperature trends long ago, they do not produce comparable data to direct measurements.
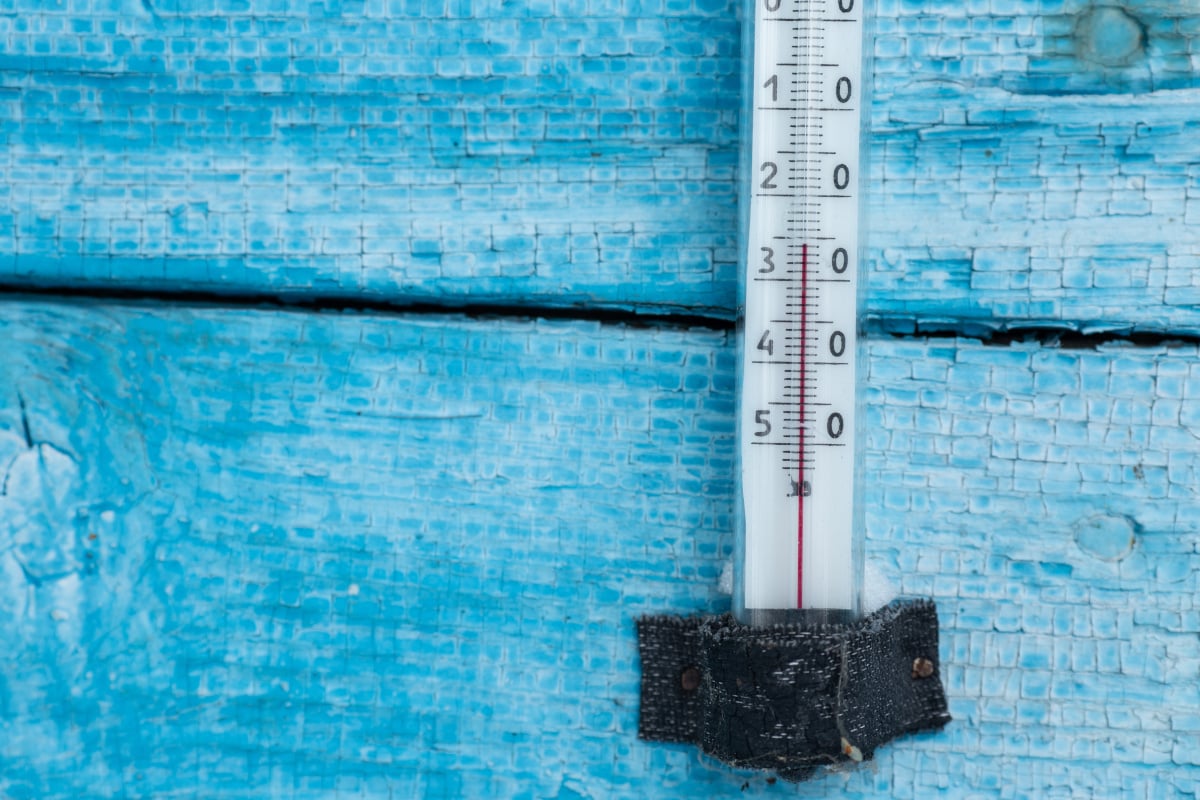
Sea temperature: evolving measurement techniques from the 1900s to today
Before 1940, the most common method for measuring the sea’s surface temperature was to throw a bucket on a rope from a boat, fill it, pull it back on board and measure the temperature of the water collected. It goes without saying that this method is subject to a number of critical issues: the air temperature, the wind and the time taken to hoist the bucket are all variables that can affect (sometimes significantly) the data collected.
Around the 1940s, however, it became a widespread practice to measure the temperature of the water channelled into ships to cool their machinery. This method allowed for more accurate measurements, which reported a temperature a few tenths of a degree higher on average than readings taken by throwing in a bucket.
It was only in the 1990s that floating buoys were adopted to measure sea temperature, and nowadays about 80% of the data collected derives from this method. Since the water intercepted by these buoys is generally deeper than the water collected inside ships and does not come into contact with machinery, buoy measurements are normally colder. Both modern data and data measured before 1940 using the bucket method has therefore been adapted to bring it into line with the data collected from ships and create a coherent historical series.
Earth temperature: how weather stations change
As for measurements on land, besides variability owing to technological innovations, there are additional factors to take into account, such as the stations’ positioning, the survey time and the surrounding conditions.
For example: if we have a weather station downstream of a mountain and we subsequently position a second one at the same latitude but at the summit, simply averaging the two measurements will give the impression that the local temperature has dropped over time. Likewise, if an industrial or urban area is built near a station, temperatures will increase.
This is why measurements must be read and interpreted according to the station’s positioning in order to return data congruent with the real-world climatic conditions.
Even the simple wear or obsolescence of stations can have an effect, as can the time when monitoring takes place. Consequently, when checking the readings, measurements far outside the local averages are usually discarded, as they are much more commonly due to malfunctions or human alterations than real changes in the climate. An emblematic case is the El Azizia station in Libya, where a measurement error by an Italian soldier led to the supposed detection of the hottest temperature ever recorded on Earth (58°).
Why is all this important?
In the case of El Azizia, an error of only two degrees led to the misinterpretation of an entire historical series of data – proof that a slight difference at first glance, if projected over time, can significantly change the interpretation of such complex data as the global temperature.
That’s why, with almost 200 years of measurements, dozens of databases and hundreds of different methods, it’s essential to correct raw data in order to have consistent and reliable information over time.
Sources:
https://climate.nasa.gov/faq/21/why-does-the-temperature-record-shown-on-your-vital-signs-page-begin-at-1880/
https://climate.nasa.gov/ask-nasa-climate/3071/the-raw-truth-on-global-temperature-records/
https://journals.ametsoc.org/view/journals/bams/94/2/bams-d-12-00093.1.xml https://www.carbonbrief.org/explainer-how-data-adjustments-affect-global-temperature-records

